Booking Analytics and Insights
Track booking performance with completed events, no-shows, conversion metrics, and team analytics
Analytics helps you understand how your booking pages perform, how meetings are distributed across your team, and where visitors drop off before confirming a booking.
You can open Analytics from the dashboard navigation. Access depends on your plan and permissions: company admins, workspace admins, and analytics viewers can use the dashboard when the Analytics feature is enabled.
 1 / 7
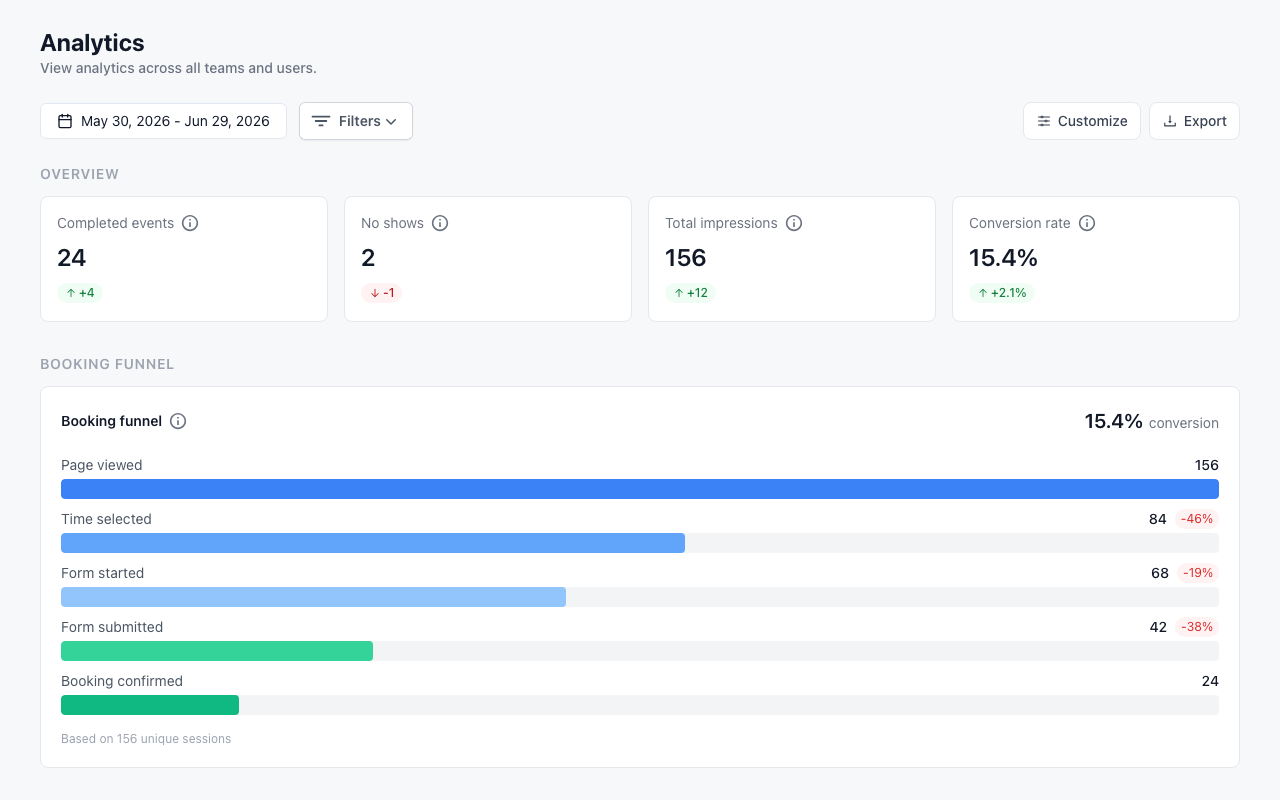
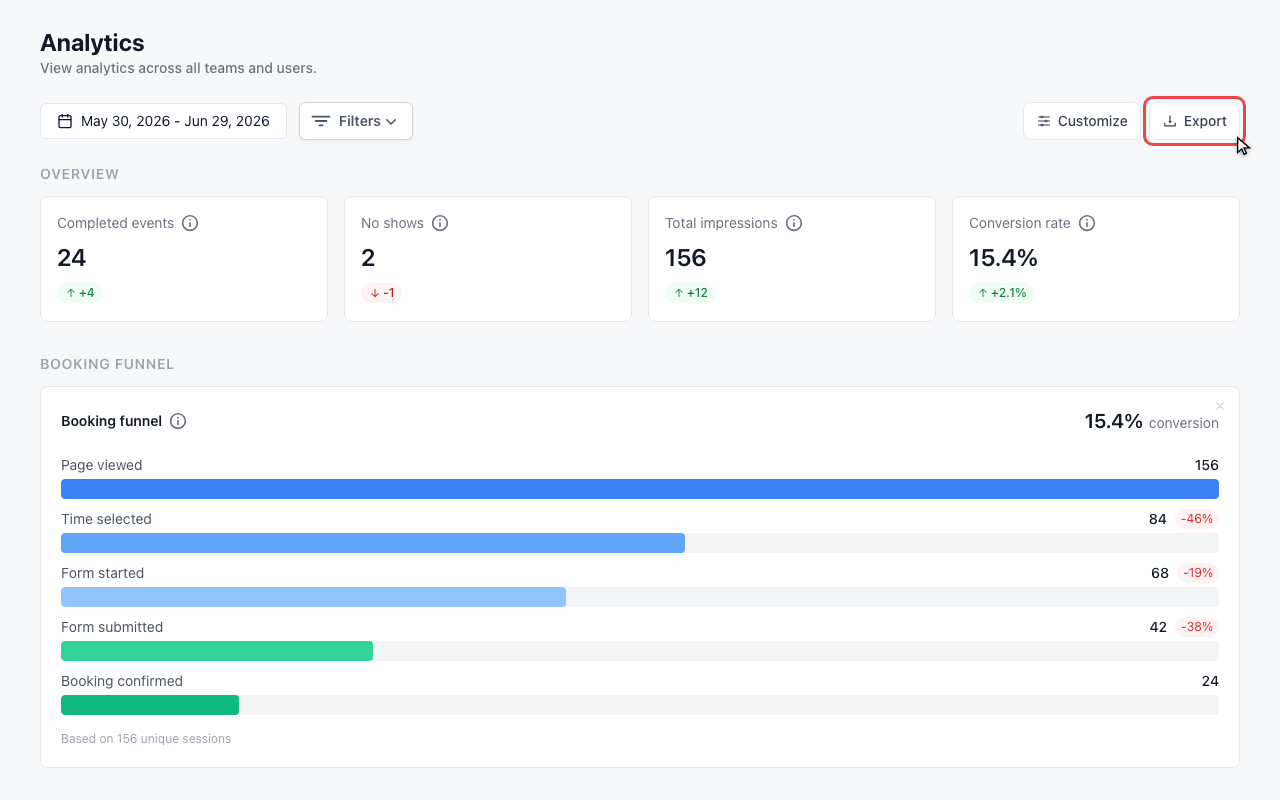
1 / 7The overview cards show completed events, no-shows, impressions, and conversion rate with the change from the previous period.
Review analytics performance
Review the overview KPIs
The overview cards show completed events, no-shows, impressions, and conversion rate with the change from the previous period.
Check the booking funnel
The booking funnel shows where visitors move from page view to confirmed booking and where they drop off.

Filter the dashboard
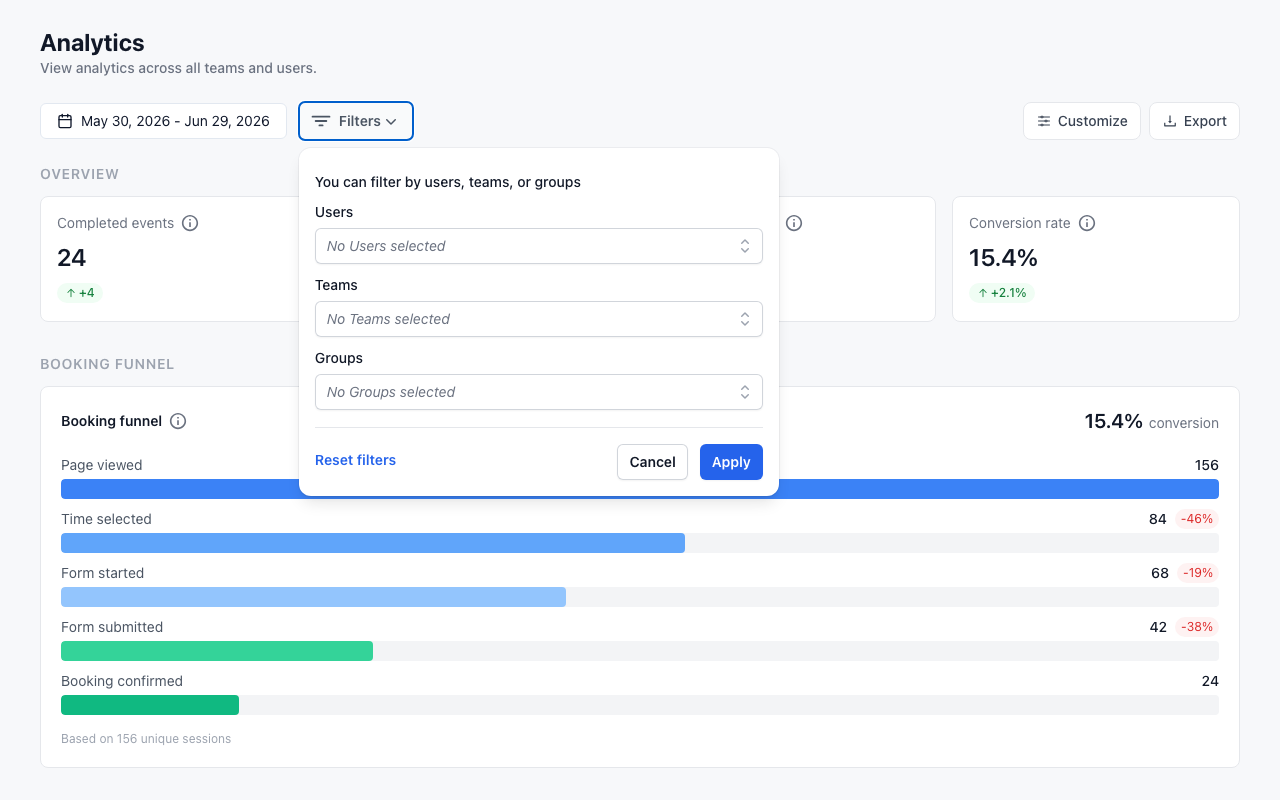
Open Filters
Use Filters to narrow the dashboard to specific users, teams, or groups.
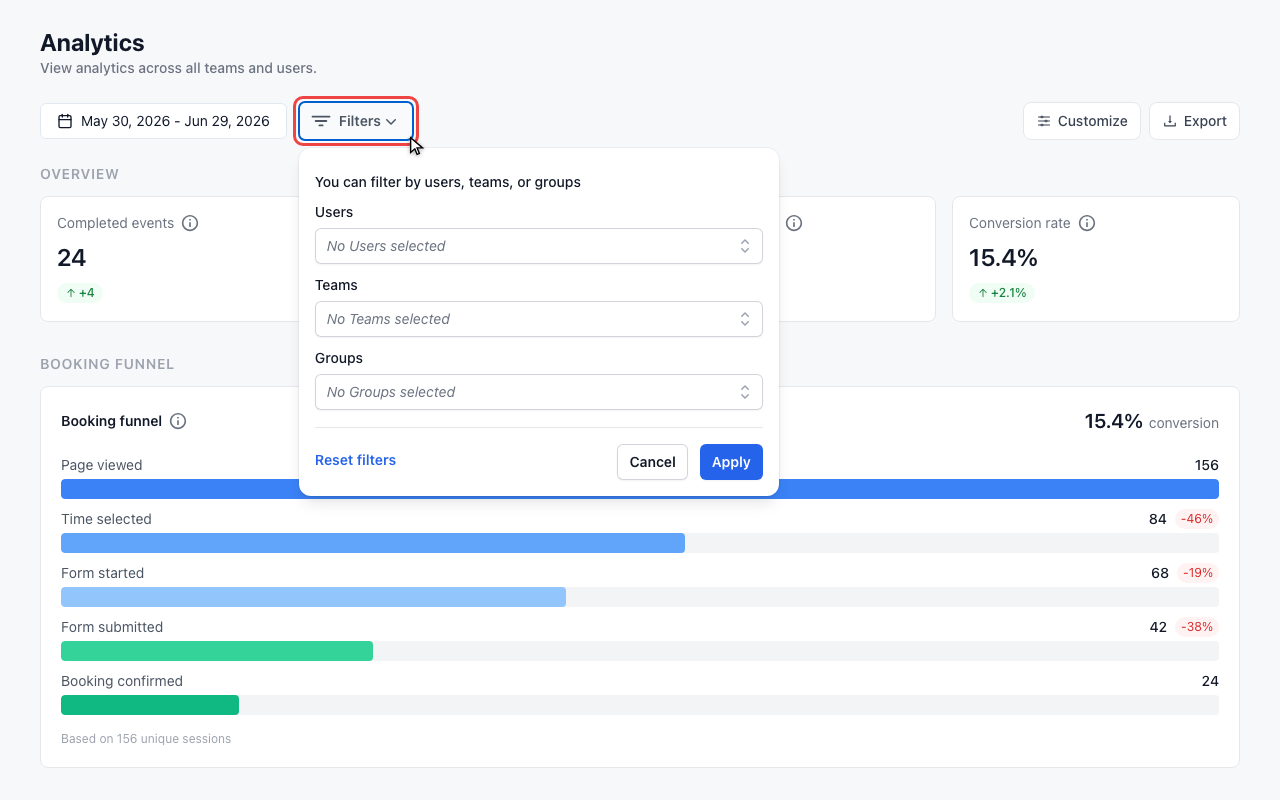
Choose the analysis scope
Select users, teams, or groups, then apply the filter to refresh the metrics.
Customize and export
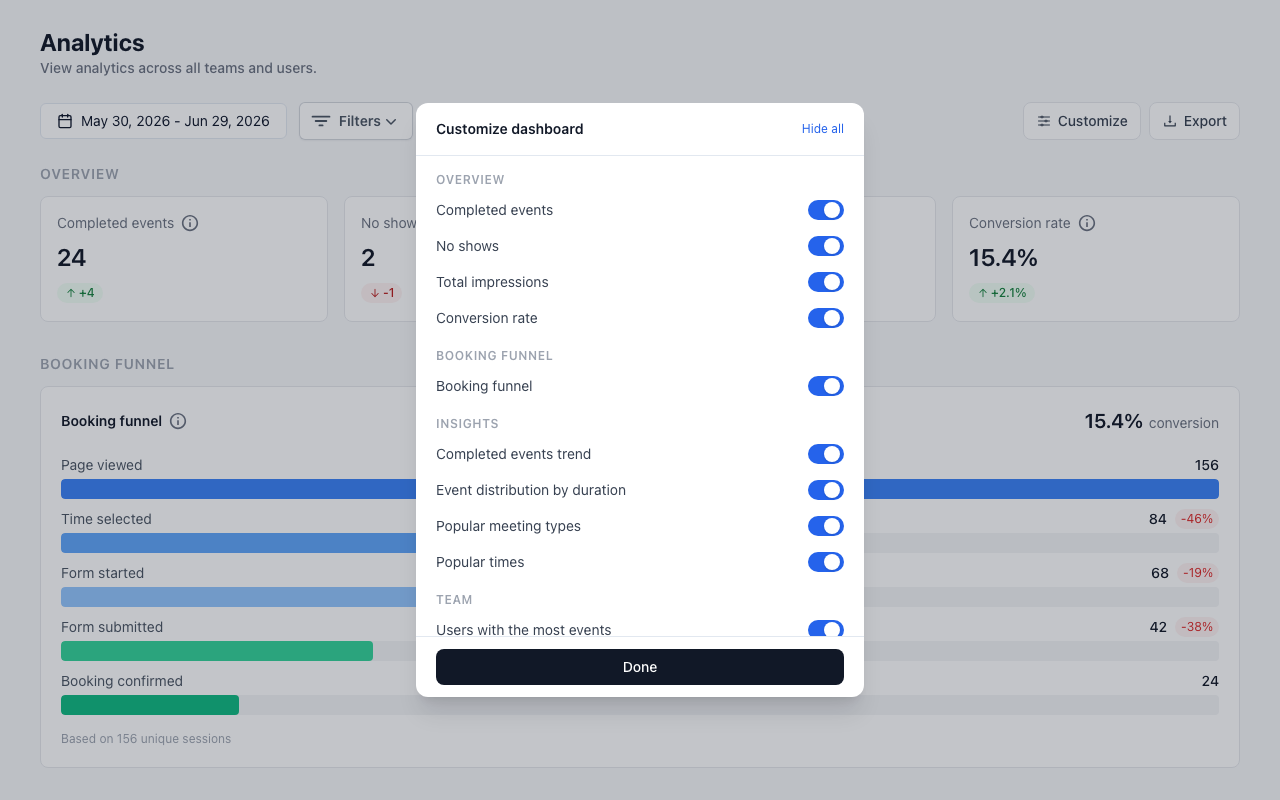
Open Customize
Use Customize to decide which metrics and charts should appear on your dashboard.

Choose visible metrics
Turn cards and charts on or off, or use Show all and Hide all for quick changes.
Export a CSV report
Click Export to download the visible analytics data as a CSV file for spreadsheet analysis.
What Analytics Shows
The Analytics dashboard starts with a date range and optional filters. Use it to answer questions like:
- How many events were completed in this period?
- How many no-shows happened?
- How many impressions did booking pages receive?
- What was the booking conversion rate?
- Which meeting types, days, durations, and team members drive the most activity?
If there is no real data for the selected period yet, meetergo may show example data so you can understand the dashboard layout.
Overview Metrics
The top KPI cards summarize the selected period:
| Metric | What it means |
|---|---|
| Completed events | Meetings that took place in the selected date range |
| No shows | Meetings marked as no-show |
| Total impressions | Booking page views in the selected period |
| Conversion rate | Share of booking page visits that became confirmed bookings |
Each card also shows the change compared with the previous period, so you can quickly spot movement without exporting data.
Booking Funnel
The Booking funnel section shows how visitors move through the booking journey. Depending on your feature access, you can see steps such as page view, time selected, form started, form submitted, and booking confirmed.
Use this section to find drop-off points. For example, a large drop after form start may mean your booking form is too long or asks for information too early.
Insights
The Insights section contains charts for booking behavior:
- Completed events trend over time
- Event distribution by duration
- Popular meeting types
- Popular times
These views help you identify peak days, strong meeting types, and underused options.
Team Analytics
The Team section compares event distribution across users. You can review who has the most or least events and use that information to adjust availability, meeting type assignment, or round-robin setup.
Filter Analytics
Use Filters to narrow the dashboard by:
- Users
- Teams
- Groups
After selecting a filter, click Apply to refresh the dashboard. Use Reset filters when you want to return to the full view.
Customize the Dashboard
Click Customize to choose which metrics and charts are visible. You can show or hide individual cards, or use Show all and Hide all to make faster changes.
This only changes how the dashboard is displayed for your analysis. It does not delete analytics data.
Export Data
Click Export to download the current analytics data as a CSV file. You can open the CSV in a spreadsheet tool to share results, combine data with other reports, or run your own analysis.
Best Practices
Review the same period regularly
Use a consistent time range, such as the last 30 days, so trends are easier to compare.
Watch conversion and no-shows together
A high conversion rate is useful only if the resulting meetings happen. If no-shows rise, review reminders, confirmation flows, and booking lead time.
Compare meeting types
Popular meeting types are not always the best-performing ones. Compare bookings, impressions, and conversion before changing your booking page strategy.
Balance team workload
Use team analytics to identify overloaded or underused users, then adjust availability, team assignment, or round-robin settings.
Troubleshooting
No Data Showing
If analytics are empty:
- Check the selected date range
- Remove filters that may be too narrow
- Confirm that bookings exist in that period
- Confirm your account has Analytics access
Metrics Look Wrong
If numbers do not match expectations:
- Check whether a filter is active
- Compare the selected date range with the bookings list
- Remember that some metrics depend on booking page impressions, not only confirmed appointments
- Export the CSV and inspect the raw sections
FAQ
Who can access Analytics?
Company admins can access Analytics when the feature is enabled. Workspace admins and analytics viewers can also access it for the relevant workspace setup.
Can I export Analytics?
Yes. Use Export to download a CSV file with the current analytics data.
Can I filter by team or user?
Yes. Use Filters to narrow the dashboard by users, teams, or groups.
Are analytics real-time?
Analytics are designed for operational reporting. New bookings usually appear shortly after they are created, but aggregated metrics can take some time to refresh.
Related Articles
Was this article helpful?
Let us know if this article answered your questions.