
CRM Reports
Where the pipeline value, win rate, stage breakdown and task numbers on the Reports tab come from
The Reports tab in the meetergo CRM is a single screen holding pipeline value, win rate, a stage breakdown and your task numbers. This guide walks it top to bottom and says exactly what each number counts.
 1 / 13
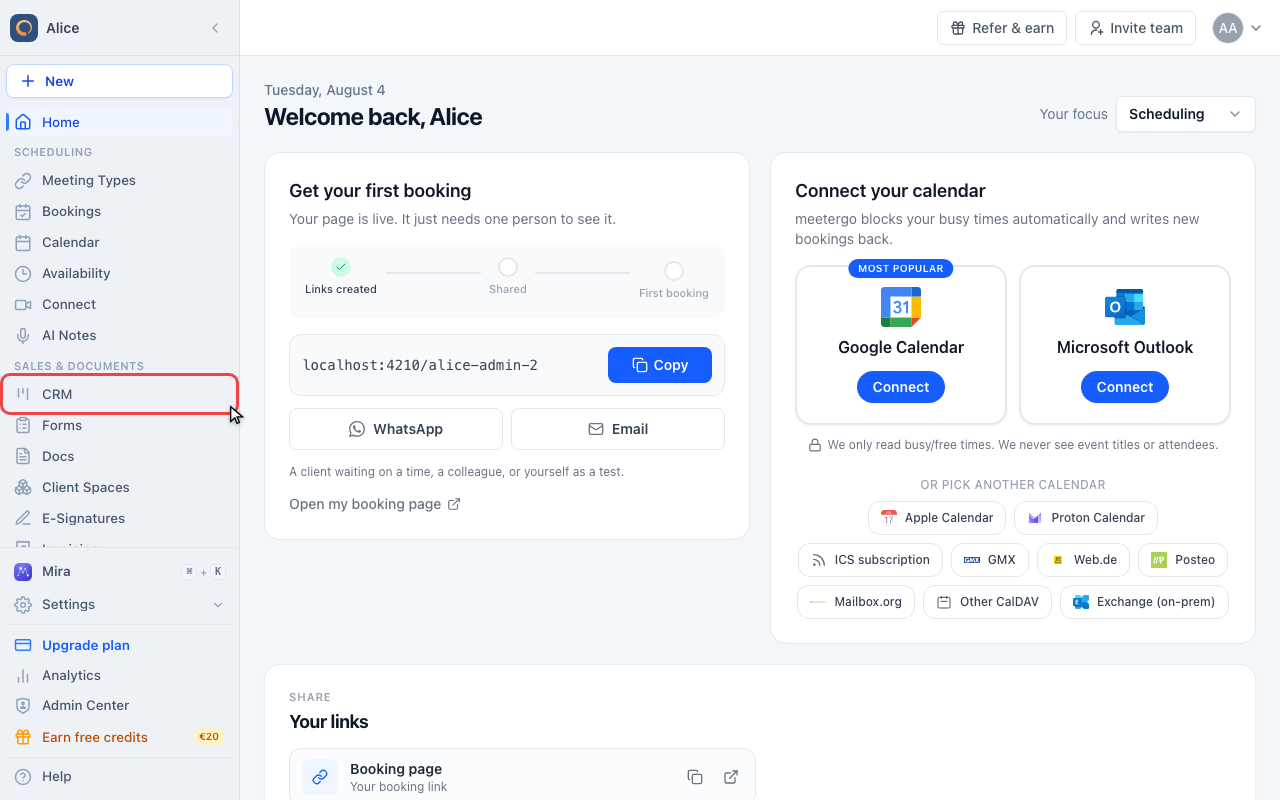
Click CRM in the sidebar.
Open Reports
Open CRM
Click CRM in the sidebar.
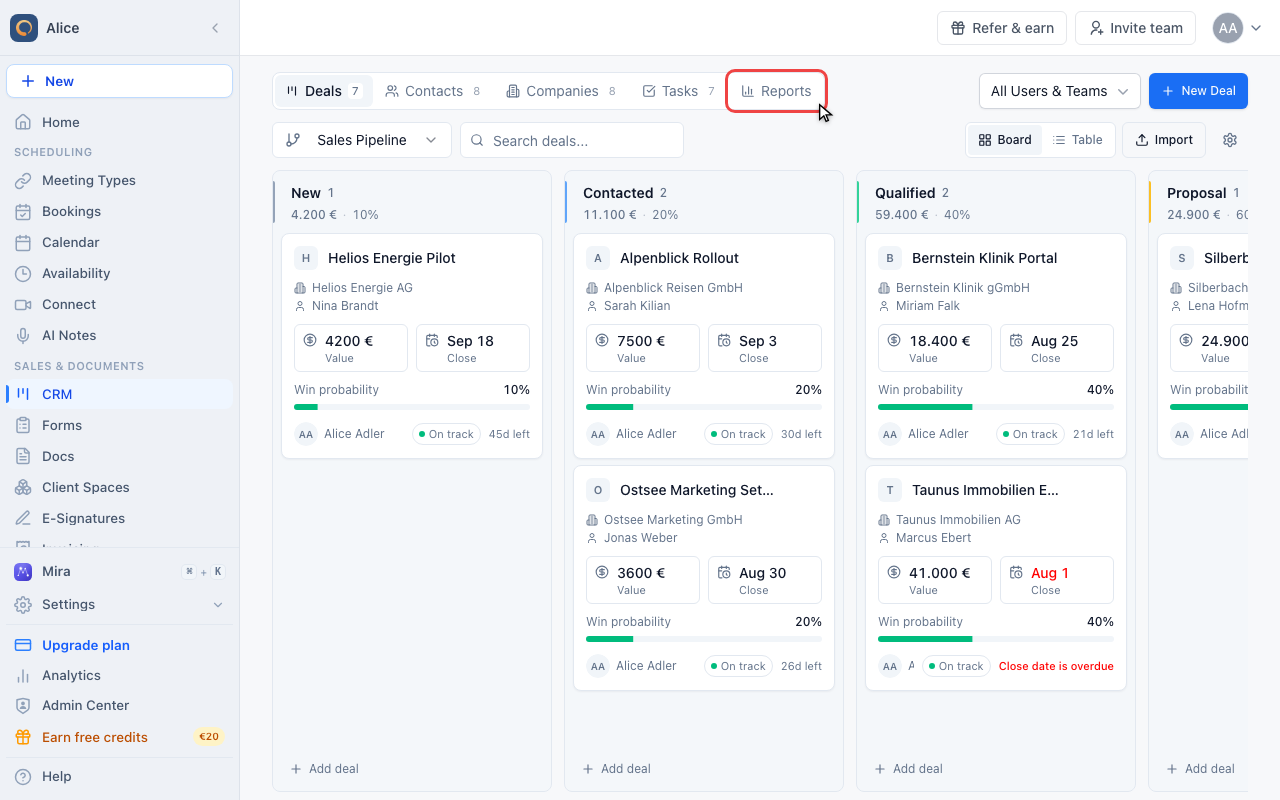
Go to Reports
Reports is the last tab in the CRM navigation, after Deals, Contacts, Companies and Tasks. It has no primary action button of its own, because nothing on this tab is created or edited.
Read the headline numbers
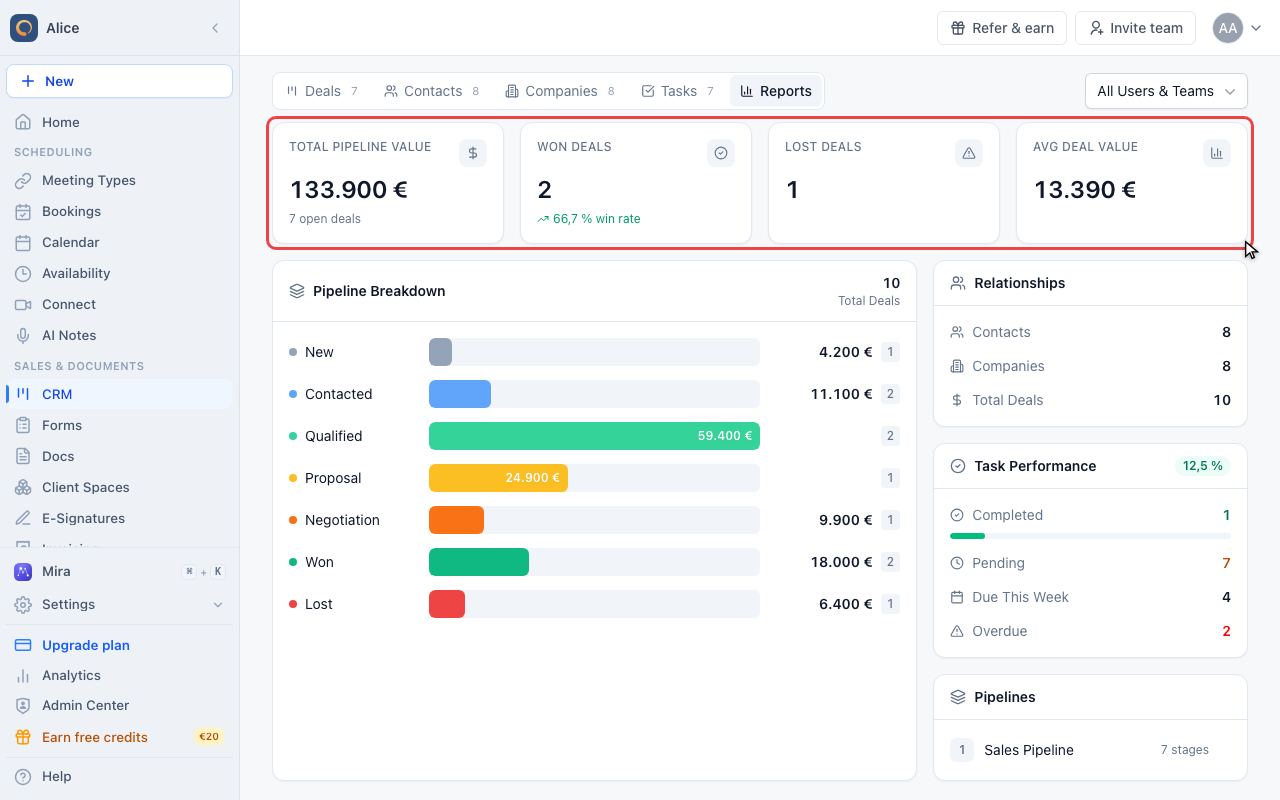
Read the four tiles
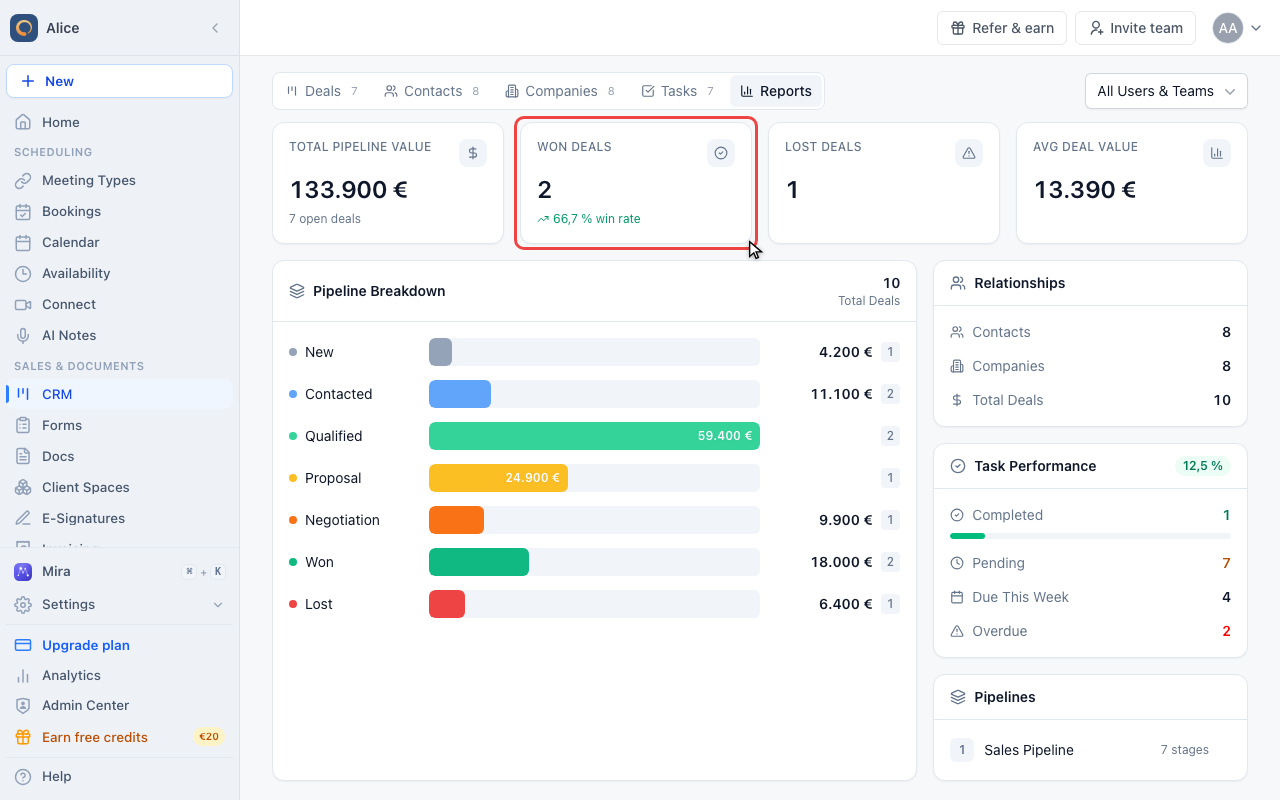
The top row is Total Pipeline Value, Won Deals, Lost Deals and Avg Deal Value. Average deal value is the total value divided by the total number of deals, so it also counts closed deals.
Check the pipeline value
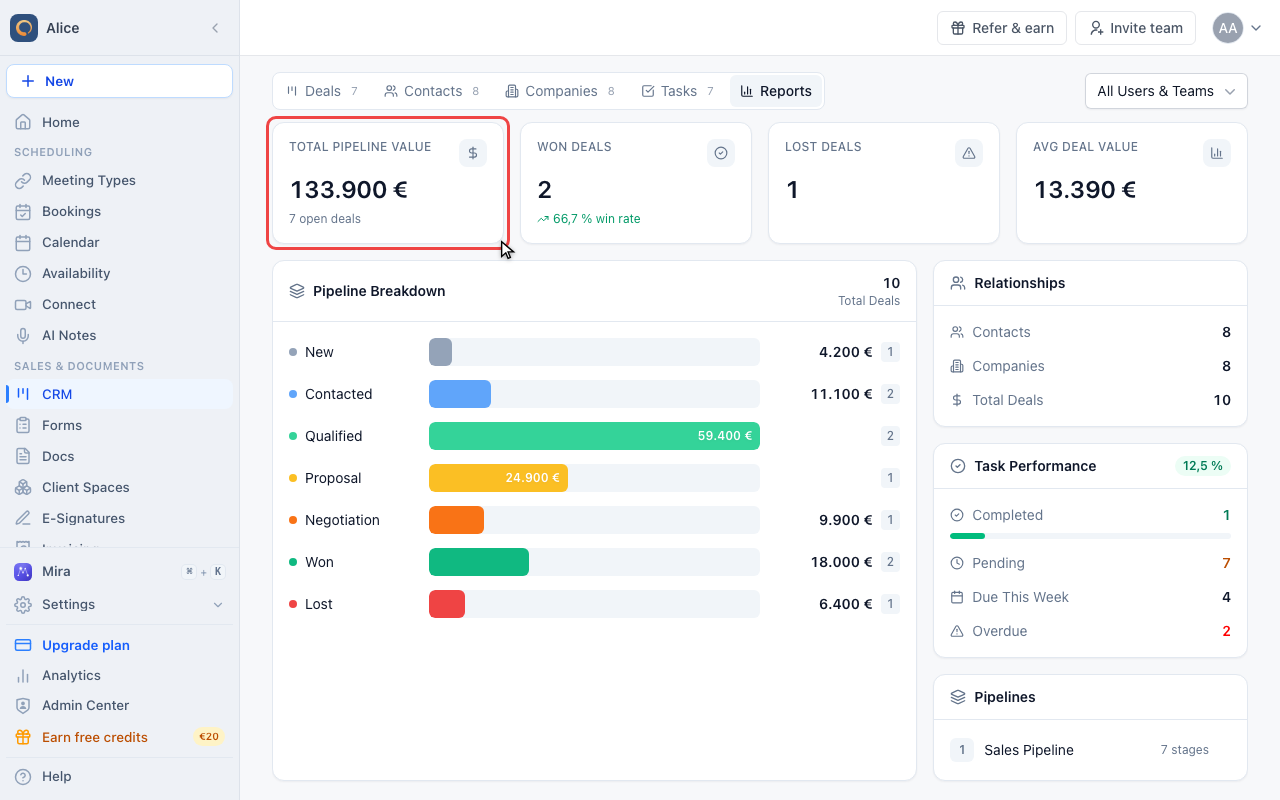
Total Pipeline Value is the sum of every deal value in scope, open and closed alike. The line underneath tells you how many of those deals are still open, which is the number to read if you want the open pipeline only.
Check the win rate
The Won Deals tile counts deals marked as won and carries the win rate underneath it. The win rate is won deals divided by closed deals, so open deals never drag it down.
See where the value sits
Read the pipeline breakdown
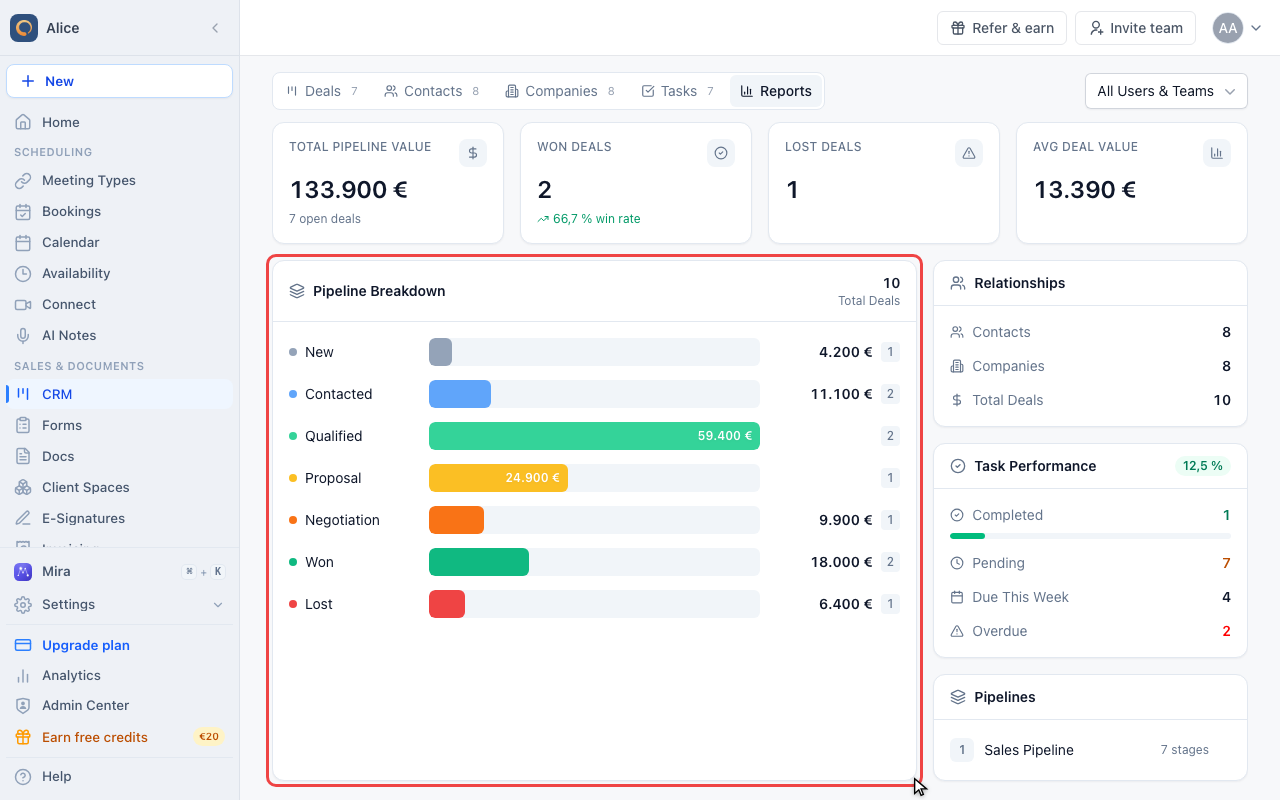
One bar per stage, sized against the largest stage rather than against the total. Every stage of every pipeline appears here, including the Won and Lost stages, so the closed deals show up at the bottom.
Read one stage
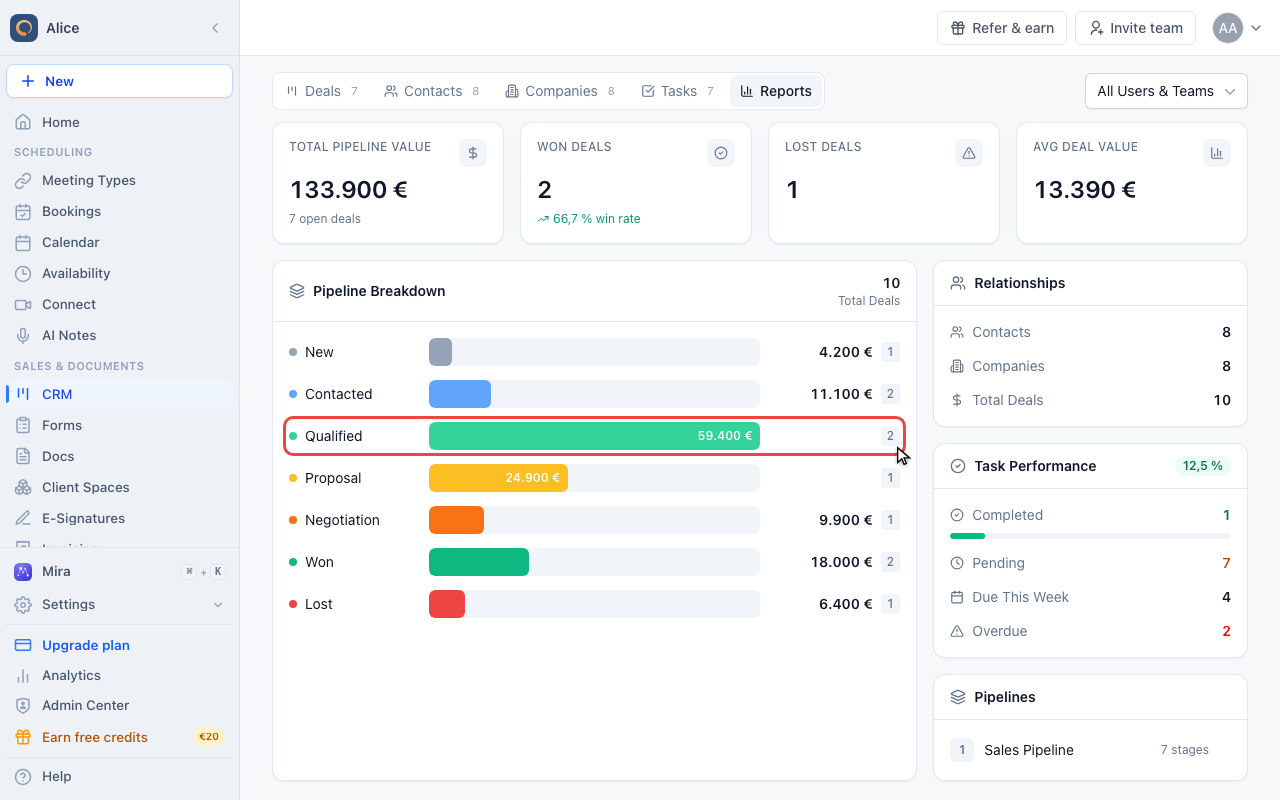
A row is the stage colour and name, the bar with the stage value, and the deal count in the grey pill on the right. A stage that holds a lot of value in few deals is a different problem from one holding many small deals.
Check relationships, tasks and pipelines
Count your records
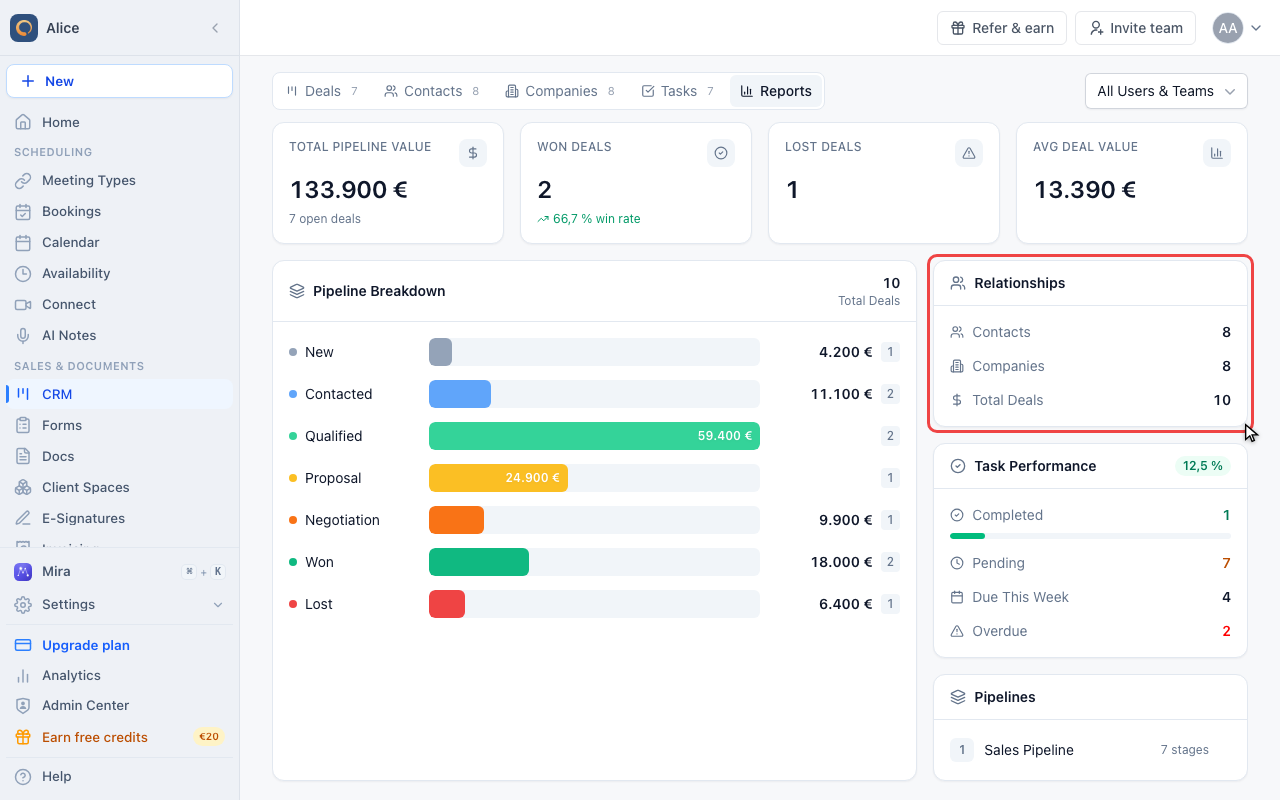
Relationships is a plain count of contacts, companies and deals. It is a data-volume check, not a performance metric: it tells you whether the CRM is being filled in.
Check the follow-up work
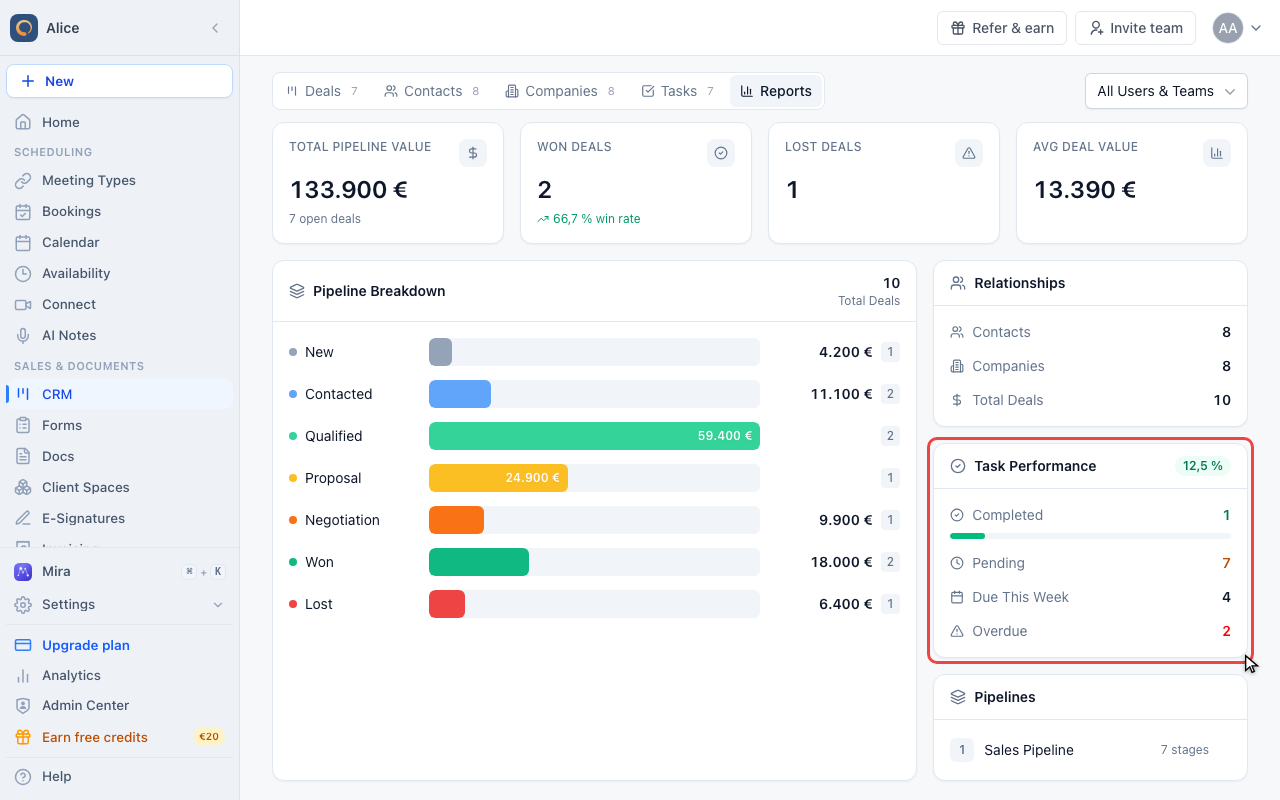
Task Performance shows completed, pending and due-this-week counts, plus an overdue row that only appears when something is actually overdue. The badge in the header is completed divided by all tasks ever created, so it falls as you add new work.
List your pipelines
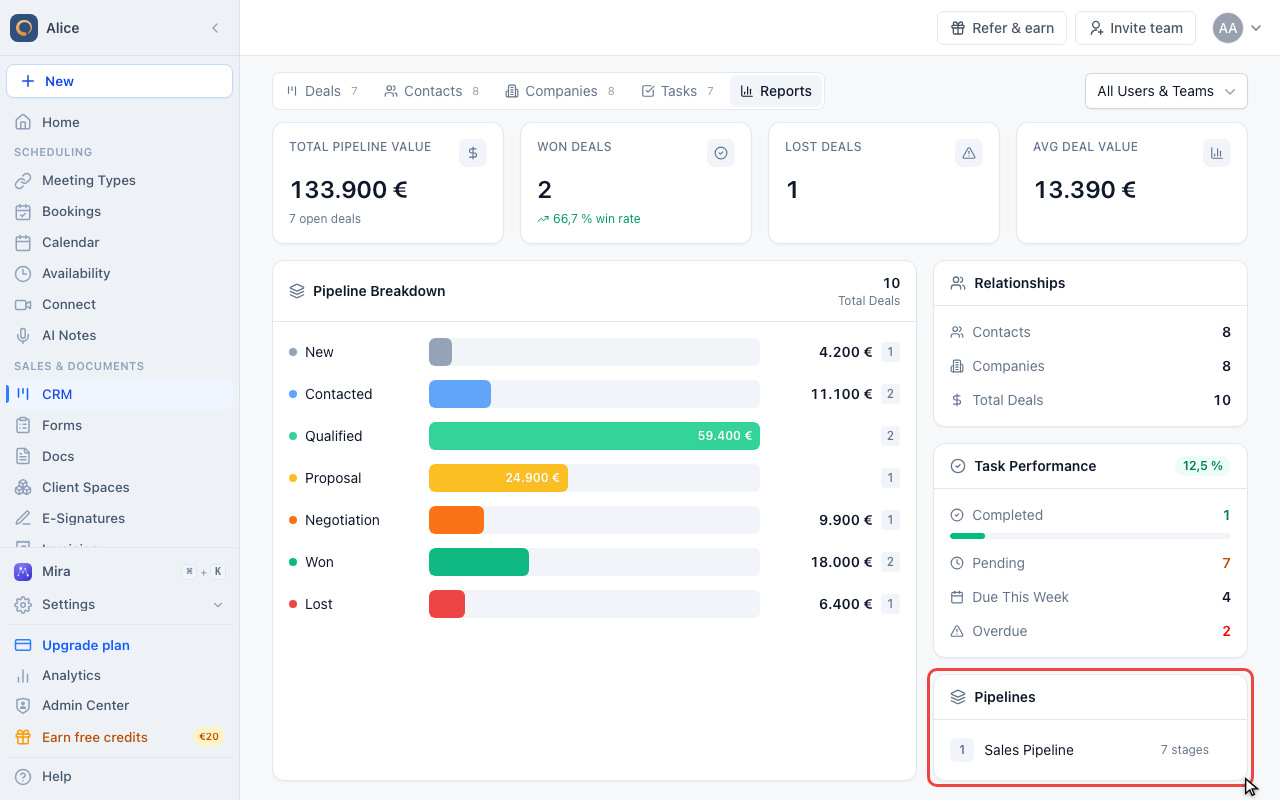
The Pipelines panel lists up to five pipelines with the number of stages each one has. It is a configuration overview, not a metric, and it does not filter the rest of the page.
Change whose numbers you see
Switch the scope
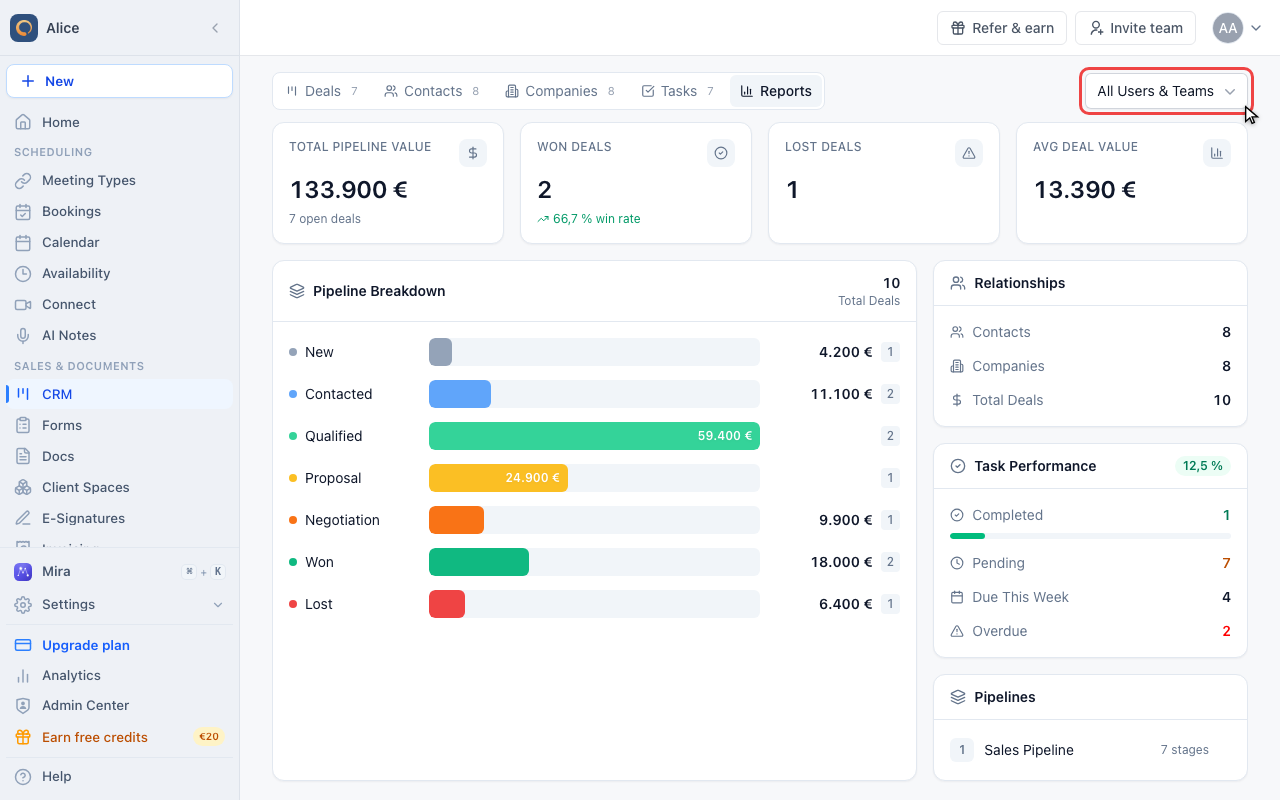
The scope picker in the CRM header is the only filter Reports has. It narrows every panel to one person or one team at once: deals and companies by owner, tasks by assignee. There is no date range and no per-pipeline filter.
Find the weighted forecast
Go back to Deals
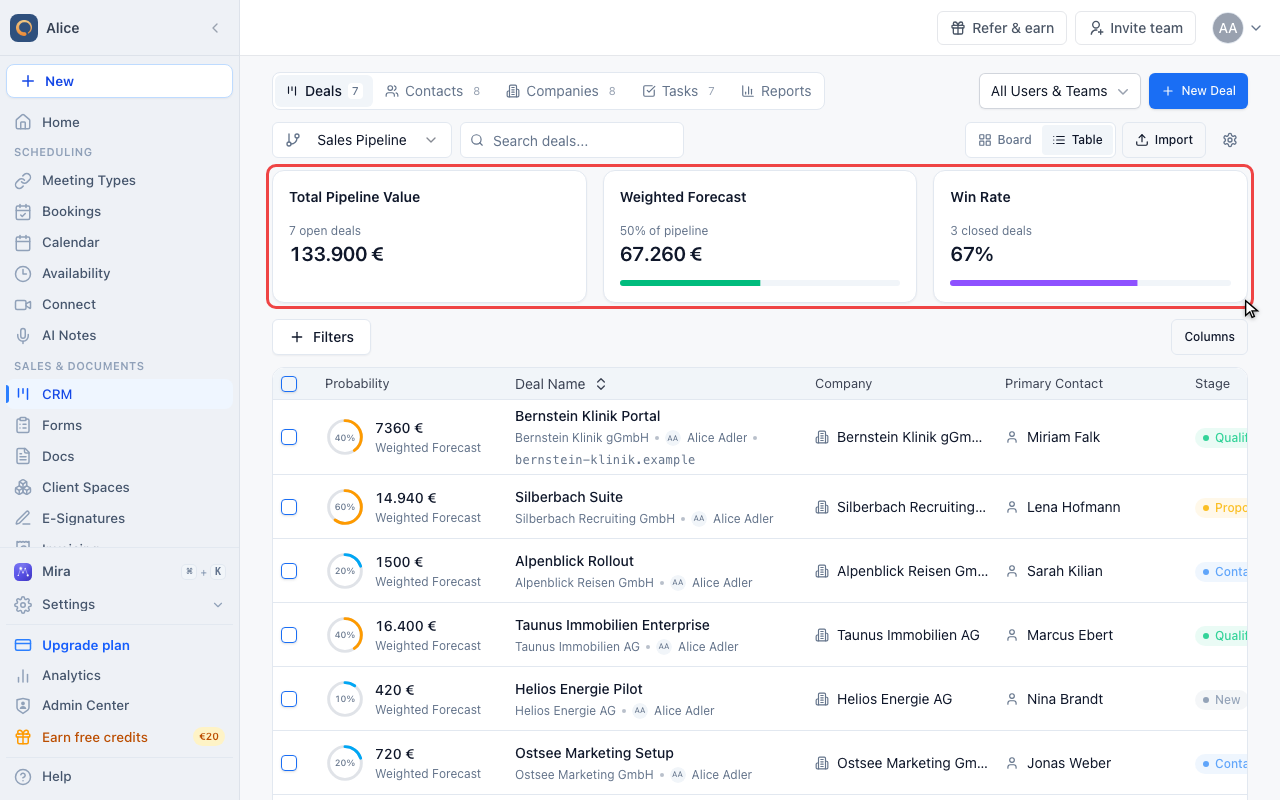
The weighted forecast is not on the Reports tab. Open Deals to find it.
Read the command strip
Above the deals table sit three cards: pipeline value, weighted forecast and win rate. The forecast multiplies each deal value by its stage win probability and adds them up, and unlike Reports this strip follows the pipeline you have selected.
What each tile counts
The four tiles across the top are the whole headline. Every one of them is computed from the deals that match the current scope, with no date limit at all: a deal you closed two years ago still counts.
Total Pipeline Value
The sum of the value of every deal in scope, open and closed together.
The small line underneath is the count of deals that are still open. If you want the open pipeline on its own, that count is the number to read, and the Deals tab shows the same total for a single pipeline.
Values are always added up and displayed in euro, even when individual deals are recorded in USD, GBP or CHF. Nothing is converted, the numbers are simply summed. Mixed-currency pipelines make this tile inaccurate.
Won Deals
The count of deals marked as won. The line underneath is the win rate:
Win rate = won deals ÷ (won deals + lost deals)
Open deals are not in that division, so the win rate does not fall while a deal is still in play. The tile shows the count only, not the total value of the deals you won.
Lost Deals
The count of deals marked as lost. There is no value figure and no breakdown by loss reason on this screen. To see why deals were lost, open the deals themselves.
Avg Deal Value
Total Pipeline Value ÷ total number of deals, rounded to whole euro. Because both halves count closed deals, a run of small won deals pulls this number down even though the open pipeline has not changed.
Pipeline Breakdown
One horizontal bar per stage, showing the total value of the deals sitting in that stage and, in the grey pill on the right, how many deals that is. The number in the panel header is the total deal count.
Bars are sized against the largest stage, not against the pipeline total, so the biggest stage always fills the row. The colour is the stage colour you set in pipeline settings.
Stages from all of your pipelines appear in this one list, including the Won and Lost stages, so closed deals show up here as well.
Identifying bottlenecks
- A lot of value in one middle stage: work is piling up before a step in your process. Compare it with the stage after it.
- A wide bar with a small deal count: one or two large deals carry the forecast. Losing one of them changes the quarter.
- A tall count with a short bar: many small deals. Check whether they are worth the follow-up effort.
The breakdown does not show how long deals have been in a stage. Use the rotting days setting on the stage and the health badge on the deal card for that.
Relationships
A plain count of contacts, companies and deals in scope. It is a data-volume check rather than a performance metric: it tells you whether the CRM is being kept up to date. There is no split into "with deals" and "without deals" and no new-this-period figure.
Task Performance
| Row | What it counts |
|---|---|
| Completed | Tasks marked complete, with a bar showing the share of all tasks |
| Pending | All tasks minus the completed ones |
| Due This Week | Open tasks due between today and seven days from now |
| Overdue | Tasks past their due date. This row is hidden when nothing is overdue |
| Header badge | Completed ÷ all tasks ever created |
The badge is a lifetime ratio, not a rate for this week, so it drops every time you add tasks and climbs as you work through them.
Pipelines
A list of up to five pipelines with the number of stages each one has. It is a configuration overview, not a metric, and clicking a row does not filter the rest of the page.
Changing what the numbers cover
The scope picker in the CRM header is the only filter Reports has. Set it to everyone, to a team, or to one person, and every panel follows at once:
| Panel | What the scope matches |
|---|---|
| The four tiles and Pipeline Breakdown | The deal owner |
| Relationships | The contact and company owner |
| Task Performance | The task assignee, not its creator |
There is no date range, no per-pipeline filter and no export on this tab.
The numbers are cached for a minute. If you have just moved a deal or ticked off a task, reload the page to see the change.
Where the weighted forecast lives
The weighted forecast is not on the Reports tab. It sits in the strip of three cards above the deals table:
- Go to CRM → Deals
- Switch the view to Table
- Read the middle card, Weighted Forecast
Weighted forecast = the sum, over every deal, of deal value × the win probability of the stage it is in.
Unlike Reports, that strip follows the pipeline selected in the picker beside it, so it answers "what is this pipeline likely to bring in" rather than "what does the whole account hold".
A low forecast usually means your deals are early in the pipeline or that the win probabilities on your stages are set conservatively. Both are worth checking in pipeline settings before you treat the number as a prediction.
When Reports is empty
Until the account has at least one deal, the tab shows "No data yet" instead of the dashboard. Contacts, companies and tasks on their own are not enough: the deal summary is what the screen is built on. Create a deal and the panels appear.
Reading the numbers
"Is my pipeline healthy?"
- Total Pipeline Value against your target, remembering it includes closed deals
- Pipeline Breakdown: is the value spread across stages, or bunched in one?
- Weighted Forecast on the Deals tab: is the probability-adjusted number still enough?
"Are we winning enough?"
- Win rate under the Won Deals tile
- Won and Lost counts side by side
- The Won and Lost bars in the breakdown, which show what those deals were worth
"Is the follow-up work getting done?"
- Overdue in Task Performance. Anything here is work that slipped
- Pending against Due This Week: how much of the open work is actually scheduled
- Switch the scope to one person to see whose queue it is
Keeping the numbers honest
Reports only reflects what is recorded, so:
- Move deals to the stage they are really in. The breakdown is grouped by stage and nothing else.
- Keep deal values current. Every tile except the counts is a sum of values.
- Mark deals won or lost when they close. Deals left open inflate the pipeline value and keep the win rate from moving.
- Use one currency per account where you can, since values are summed as euro.
FAQ
How often do reports update?
They are recalculated from live data, but the browser caches each summary for a minute. Reload the page after a change if the number looks stale.
Can I create custom reports?
No. This screen is fixed and there is no report builder or export button. For your own analysis, export contacts from the Contacts tab or use the API.
Can I filter reports by date?
No. Every number covers all time. The only filter is the scope picker.
Can I see one pipeline on its own?
Not on Reports, where all pipelines are added together. The command strip above the deals table does follow the selected pipeline.
Why does the total pipeline value look too high?
It includes won and lost deals. The count of open deals is on the same tile, and the Won and Lost bars in the breakdown show what the closed deals contribute.
What is a good win rate?
Win rates vary by industry and deal type. B2B SaaS commonly sees 15-30%. Establish your own baseline first, then work on improving it.
Why is the task completion badge so low?
It compares completed tasks with every task ever created, not with this week's. A busy account with lots of new tasks will always show a modest percentage.
Report glossary
| Term | Definition |
|---|---|
| Total Pipeline Value | Sum of all deal values in scope, open and closed |
| Open deals | Deals with neither a won nor a lost date |
| Win rate | Won deals ÷ closed deals |
| Avg Deal Value | Total pipeline value ÷ total deal count |
| Weighted Forecast | Sum of deal value × stage win probability. On the Deals tab |
| Stage value | Sum of the values of the deals currently in a stage |
| Task completion | Completed tasks ÷ all tasks ever created |
Related Articles
Was this article helpful?
Let us know if this article answered your questions.